Predictive Maintenance Dashboard
The Challenge
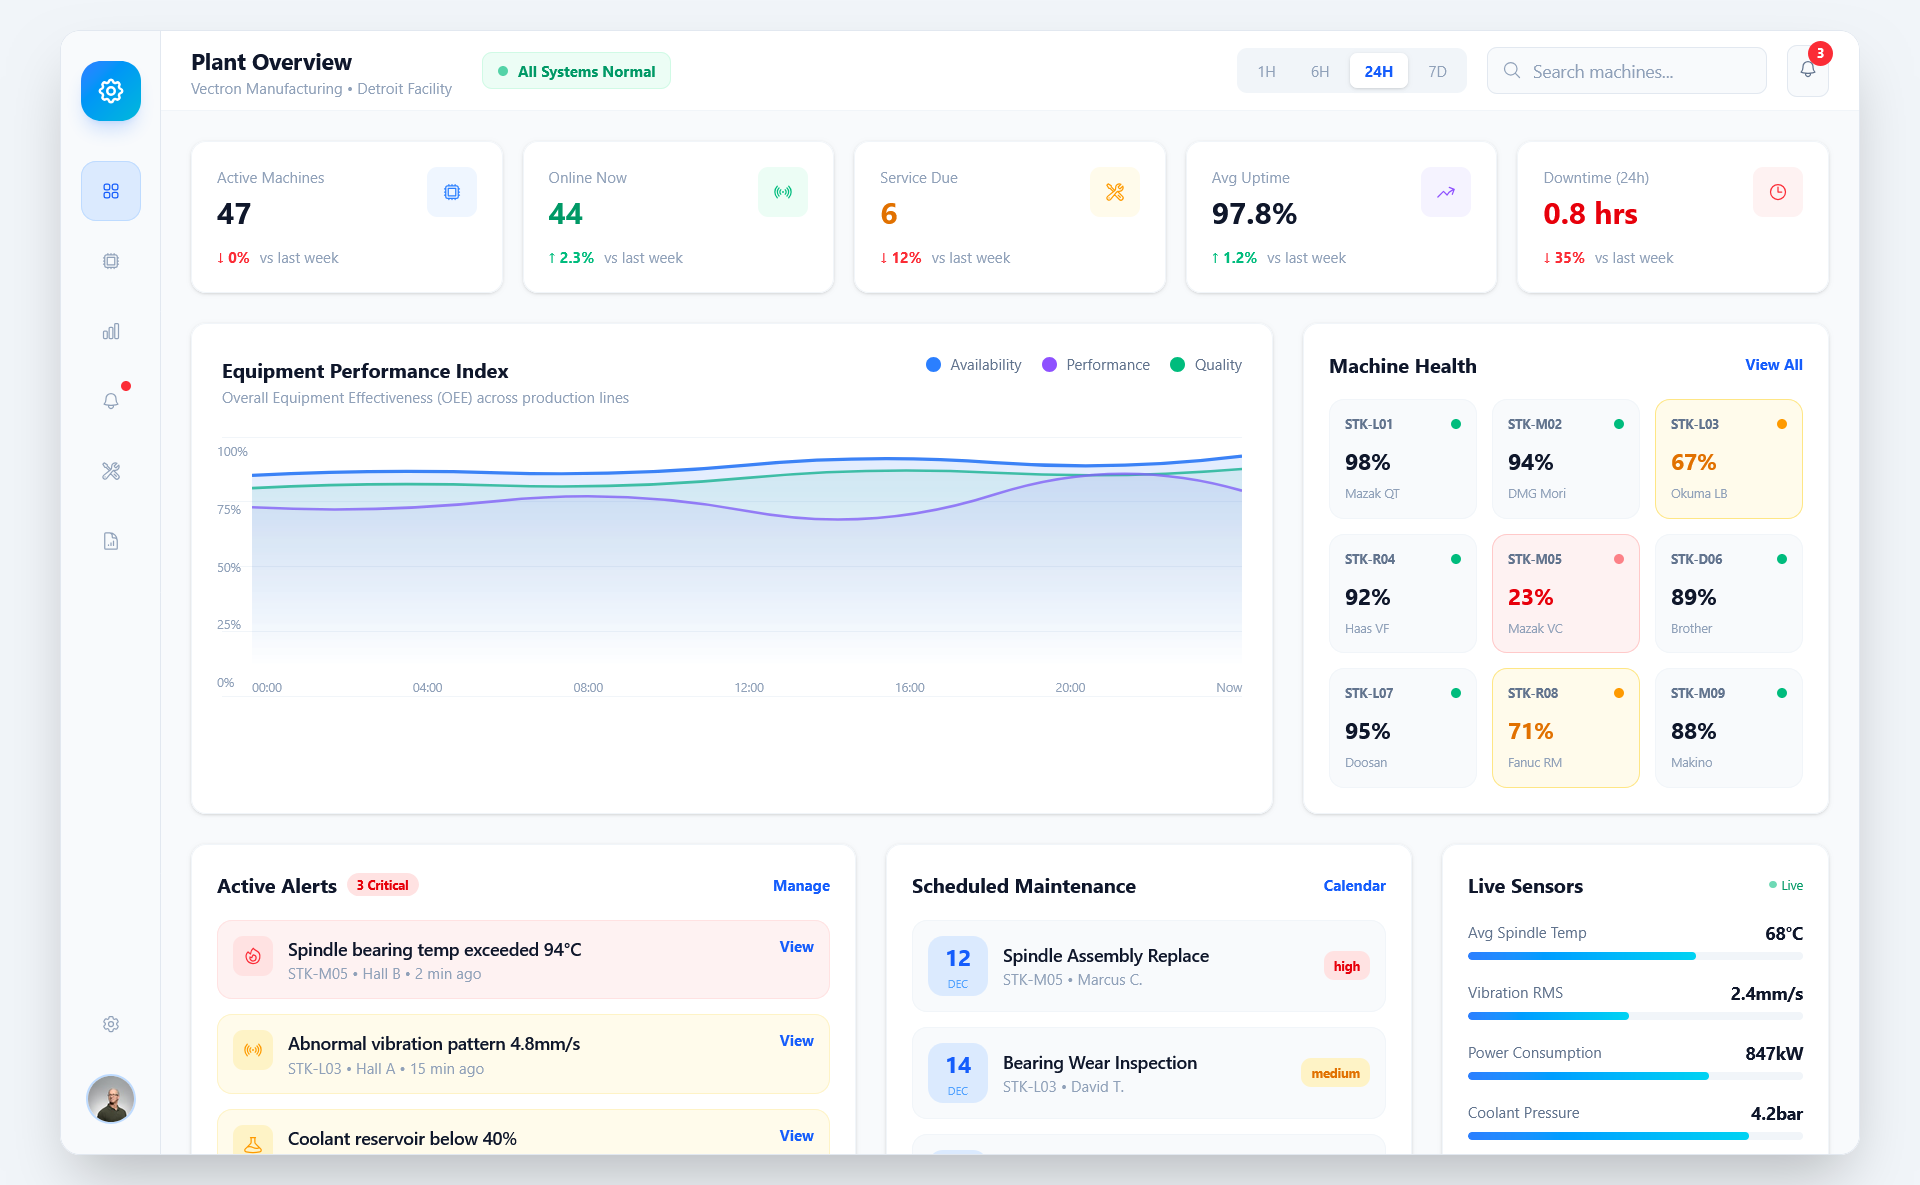
Sensors were already installed on the production floor, but data landed in isolated vendor dashboards. Maintenance supervisors lacked a single view to prioritise work orders across three sites.
Our Solution
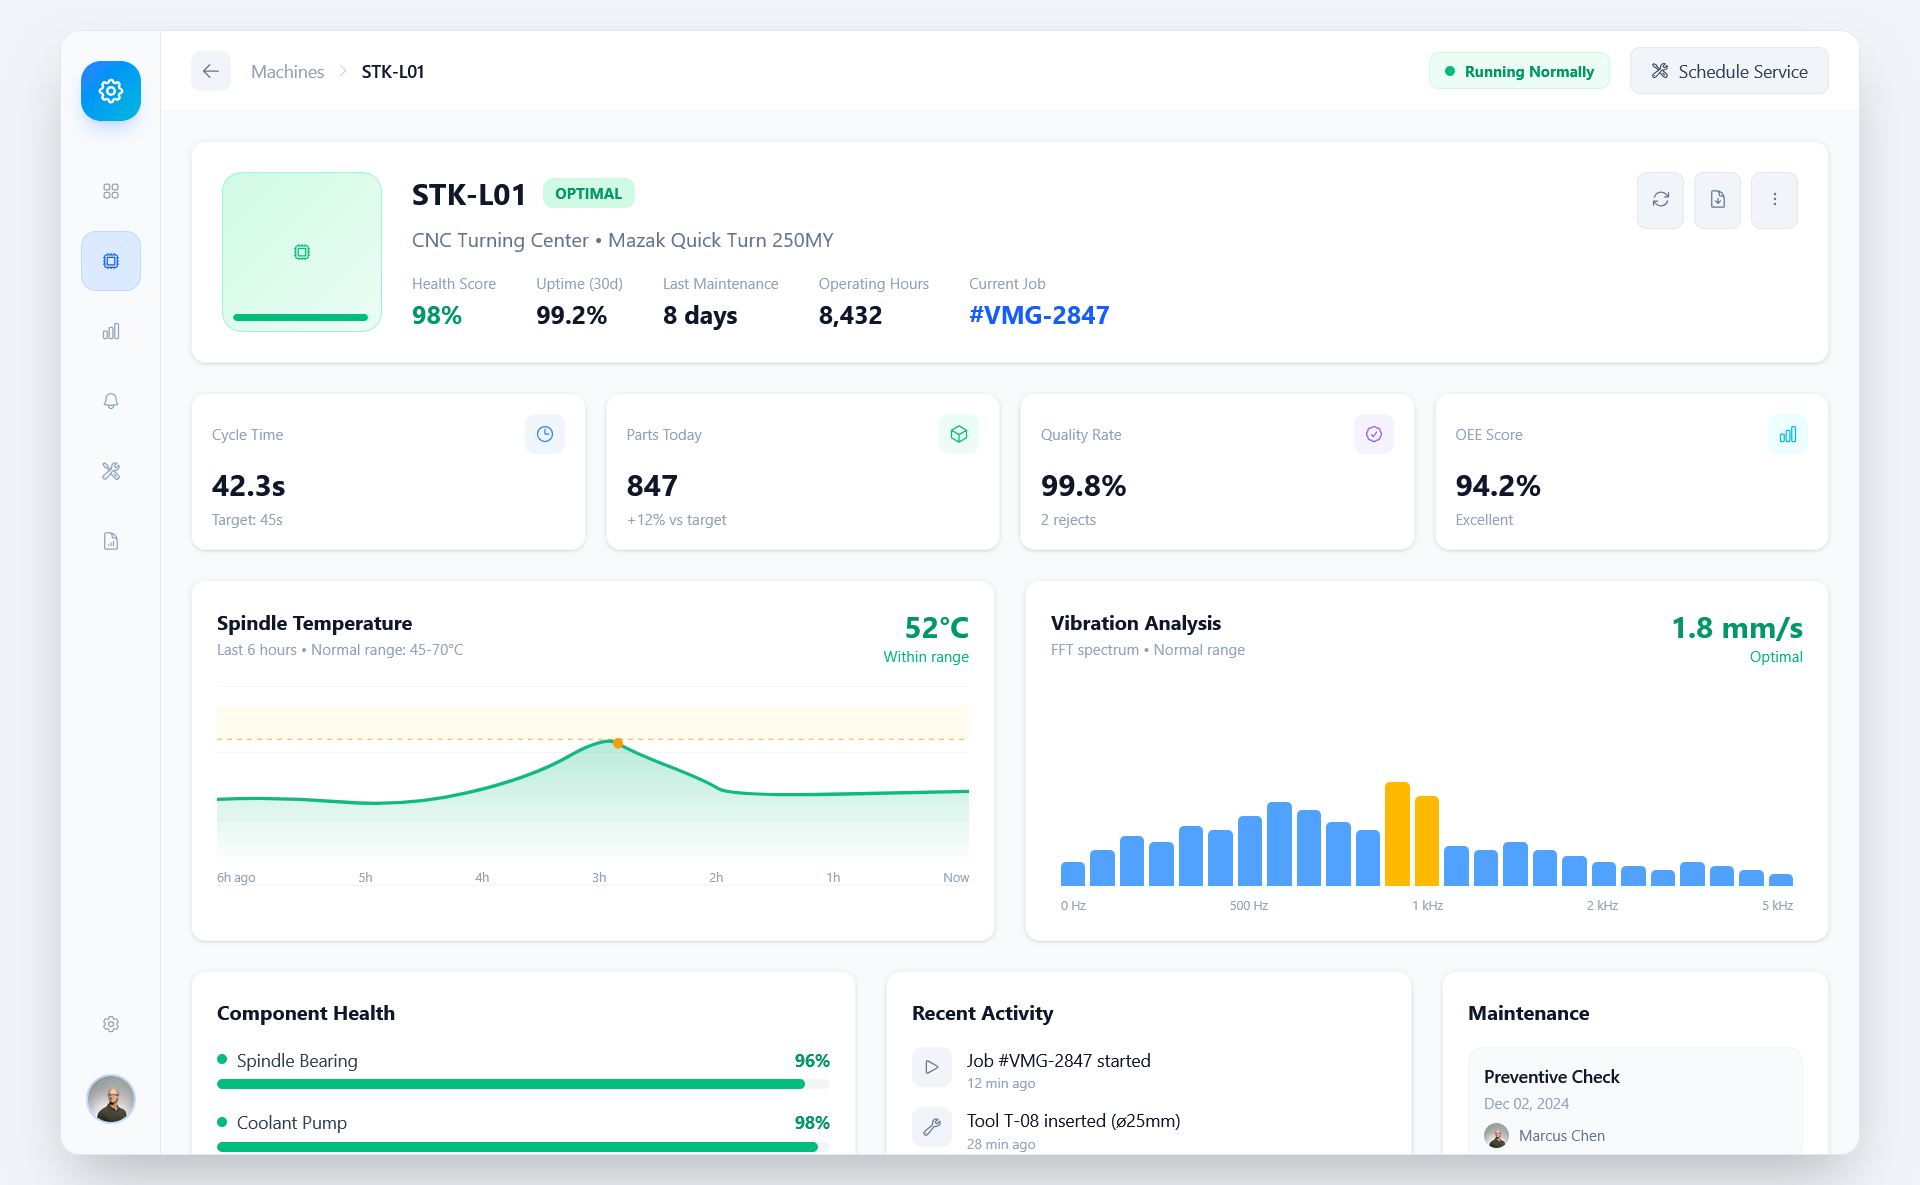
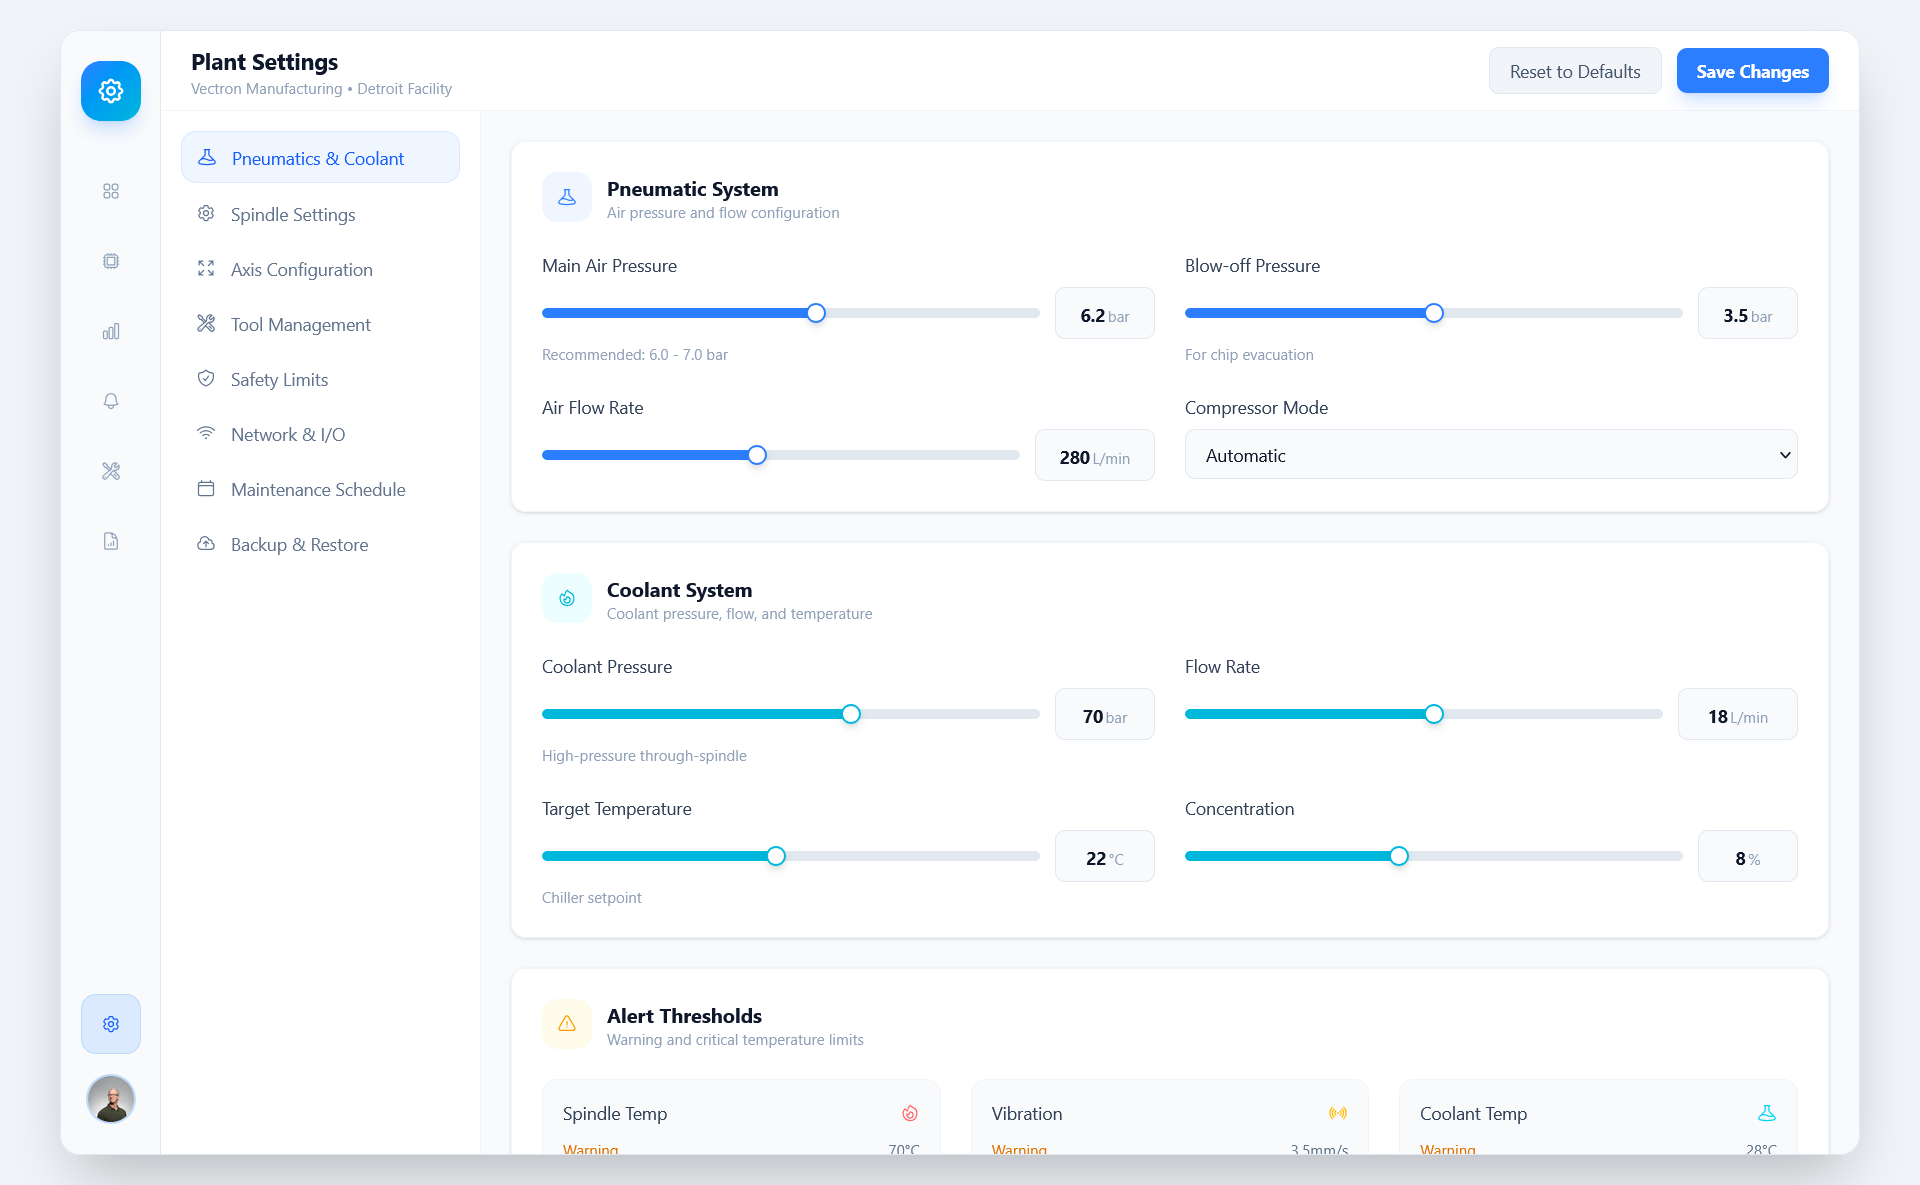
We built a time-series ingestion pipeline, normalised telemetry, and surfaced anomalies that correlate with historical breakdowns. Maintenance tickets are raised automatically in Microsoft Dynamics when thresholds are exceeded.
Key Features Delivered
- Streaming ingestion with device-level health scores
- Mobile-friendly dashboard for technicians on the floor
- Automatic ticket creation in Microsoft Dynamics 365
- Historical playback to validate recommended actions
Project Gallery
Explore the project visuals


Technology Stack
Powered by industry-leading technologies
Business Impact
Unscheduled stoppages dropped by a third during the first six months, and weekly stand-ups now revolve around a shared dashboard instead of anecdotal reports. Leadership finally has visibility into equipment utilisation across all facilities.
Project Timeline
Assessment & Data Review
3 weeks
Mapped telemetry sources, validated data quality, and agreed on alert thresholds.
Pipeline & Modelling
6 weeks
Normalised sensor data, created anomaly detection models, and produced baseline dashboards.
Application Build
5 weeks
Developed the Vue front-end, device overview screens, and technician task list.
Rollout
4 weeks
Piloted in the Gothenburg plant, gathered feedback, and expanded to remaining sites.
"The dashboard gives us a calm overview of what actually needs attention. We no longer firefight—we plan our maintenance windows with data on the table."
Ready to Transform Your Business?
Let's discuss how we can help you achieve similar results
Related Projects
Trusted By Industry Leaders
Proven Track Record of Excellence
Delivering AI-powered solutions to enterprises worldwide with measurable ROI and lasting impact

